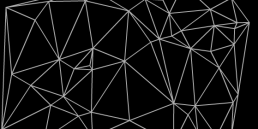
I recently used Prefuse’s Flare. It is a data visualisation package that has some really nice features.
Click and drag the nodes, if can catch them!
Here is a basic example of what I built and then extended for the job.
package com.kafkaris
{
	import flare.physics.Simulation;
	import flare.vis.controls.DragControl;
	import flare.vis.controls.HoverControl;
	import flare.vis.data.Data;
	import flare.vis.data.NodeSprite;
	import flare.vis.operator.layout.ForceDirectedLayout;
	import flare.vis.Visualization;
	import flash.display.Sprite;
	import flash.display.StageAlign;
	import flash.display.StageScaleMode;
	import flash.events.Event;
	import flash.geom.Rectangle;

	public class Main extends Sprite
	{

		public function Main()
		{
			if (stage) init()
			else addEventListener(Event.ADDED_TO_STAGE, init);
		}

		private function init(e:Event = null):void
		{
			removeEventListener(Event.ADDED_TO_STAGE, init);

			stage.align = StageAlign.TOP_LEFT;
			stage.scaleMode = StageScaleMode.NO_SCALE;

			// all visualisations need a Data object
			var data:Data = new Data();

			// set the node defaults
			data.nodes.setDefaults( {
				"x": stage.stageWidth,
				"y": stage.stageHeight,
				"shape": "circle",
				"size" : 2,
				"mouseChildren": false
			});

			// set the edge (lines linking the nodes) defaults
			data.edges.setDefaults( {
				"lineWidth": 1,
				"alpha": 1
			});

			// create 10 nodes in the data
			for (var i:int = 0; i < 10; i++)
			{
				data.addNode();
			}

			// randomly link the nodes
			for (var j:uint = 0; j < data.nodes.length; j++)
			{
				var k:uint = j + 1;
				if (k == data.nodes.length)
				{
					k = 0;
				}

				if (j % 4 == 0)
				{
					data.addEdgeFor(data.nodes[j], data.nodes[Math.round(Math.random() * data.nodes.length)]);
				}

				data.addEdgeFor(data.nodes[j], data.nodes[k]);
			}

			// create the visualisation that the data will be held by
			var vis:Visualization = new Visualization(data);
			// keeps the nodes in an area with a 50px margin
			vis.bounds = new Rectangle(50, 50, stage.stageWidth - 100, stage.stageHeight - 100);

			// enables the nodes to be dragged by the mouse
			var dc:DragControl = new DragControl(NodeSprite);
			vis.controls.add(dc);

			// enables the node to move to the front when the mouse moves over it
			var hc:HoverControl = new HoverControl(NodeSprite, HoverControl.MOVE_TO_FRONT);
			vis.controls.add(hc);

			// additional tweaks to how the nodes interact
			var sim:Simulation = new Simulation(0, 0, .1, -50);

			// sets up the layout including some values
			var fdl:ForceDirectedLayout = new ForceDirectedLayout(true, 1, sim);
			fdl.defaultParticleMass = 10;
			fdl.defaultSpringLength = 150;
			fdl.defaultSpringTension = 1;

			// adds the layout to the visualisation
			vis.operators.add(fdl);
			// kinda like the renderer
			vis.continuousUpdates = true;

			addChild(vis);
			// enables you to click behind the bounding area.
			stage.removeEventListener(Event.RENDER, vis.setHitArea);
		}

	}

}
Get the library here:
Flare – Data Visualisation
JK
Related Posts