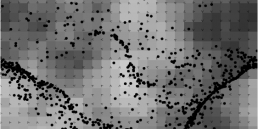
This library has been around for a while but I only just discovered it a few weeks back.
(Drag you mouse over the example and click to switch between Delaunay and Voronoi)
A recent project required thousands of points to be displayed and lines connecting them all. A colleague then introduced me to Delaunay triangulation.
I started searching around for any libraries that had been build that used Delaunay. I cam across a few and after some testing found that as3delaunay was exactly what I needed.
The library also allows for drawing Voronoi diagrams also.
I found it rather hard to find a basic example so here is some code to get you started:
package com.kafkaris.delaunaydemo {
	import com.nodename.Delaunay.Voronoi;
	import com.nodename.geom.LineSegment;

	import flash.display.Sprite;
	import flash.events.Event;
	import flash.geom.Point;
	import flash.geom.Rectangle;

	public class Example extends Sprite {
		private var _points:Vector.<Point>;
		private var _plotBounds:Rectangle;
		private var _voronoi:Voronoi;
		private var _segments:Vector.<LineSegment>;

		public function Example() {
			if (stage) init();
			else addEventListener(Event.ADDED_TO_STAGE, init);
		}

		private function init(event:Event = null):void {
			_points = new Vector.<Point>();

			for (var i:uint = 0; i < 50; i++) {
				var point:Point = new Point(Math.random() * stage.stageWidth, Math.random() * stage.stageHeight);
				_points.push(point);
			}

			_plotBounds = new Rectangle(0, 0, stage.stageWidth, stage.stageHeight);
			_voronoi = new Voronoi(_points, null, _plotBounds);

			_segments = _voronoi.delaunayTriangulation();

			for each (var segment:LineSegment in _segments) {
				graphics.lineStyle(2, 0x000000, 1);
				graphics.moveTo(segment.p0.x, segment.p0.y);
				graphics.lineTo(segment.p1.x, segment.p1.y);
			}
		}
	}
}
If you want to use this example to draw a Voronoi diagram instead, swap this line:
_segments = _voronoi.delaunayTriangulation();
with this line:
_segments = _voronoi.voronoiDiagram();
Really enjoyed using this library, a good one to keep in mind for data visualisations.
JK


